OpenAltimetry and Earth Engine Use Examples
Contents
OpenAltimetry and Earth Engine Use Examples#
For the functions shown in the Google Earth Engine tutorial.
from utils.oa import dataCollector
If needed, uncomment below to authenticate Earth Engine.
# ee.Authenticate()
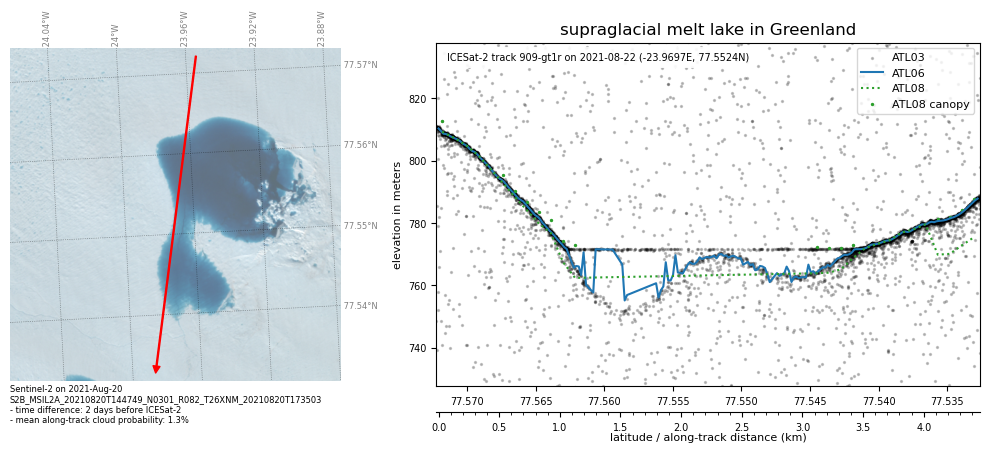
Example data from this tutorial: melt lake in Greenland#
url = 'http://openaltimetry.org/data/api/icesat2/atl03?date=2021-08-22&minx=-23.989069717620517&miny=77.53261687779506&maxx=-23.950348700496775&maxy=77.57222464044443&trackId=909&beamName=gt1r&beamName=gt1l&outputFormat=json'
is2data = dataCollector(oaurl=url,beam='gt1r')
fig = is2data.visualize_sentinel2(max_cloud_prob=5, title='supraglacial melt lake in Greenland')
--> Getting data from OpenAltimetry.
---> requesting ATL03 data... 6314 data points.
---> requesting ATL06 data... 198 data points.
---> requesting ATL07 data... No data.
---> requesting ATL08 data... 26 data points.
---> requesting ATL10 data... No data.
---> requesting ATL12 data... No data.
---> requesting ATL13 data... No data.
The ground track is 4.4 km long.
Looking for Sentinel-2 images from 2021-08-12T12:00:00 to 2021-09-01T12:00:00 --> there are 4 cloud-free images.
Looking for Sentinel-2 images from 2021-08-02T12:00:00 to 2021-09-11T12:00:00 --> there are 8 cloud-free images.
Looking for Sentinel-2 images from 2021-07-23T12:00:00 to 2021-09-21T12:00:00 --> there are 24 cloud-free images.
--> Closest cloud-free Sentinel-2 image to ICESat:
    - product_id: S2B_MSIL2A_20210820T144749_N0301_R082_T26XNM_20210820T173503
    - time difference: 2 days before ICESat-2
    - mean along-track cloud probability: 1.3
--> Downloaded the 8-bit RGB image as my-satellite-image.tif.
--> Saved plot as my-plot.jpg.
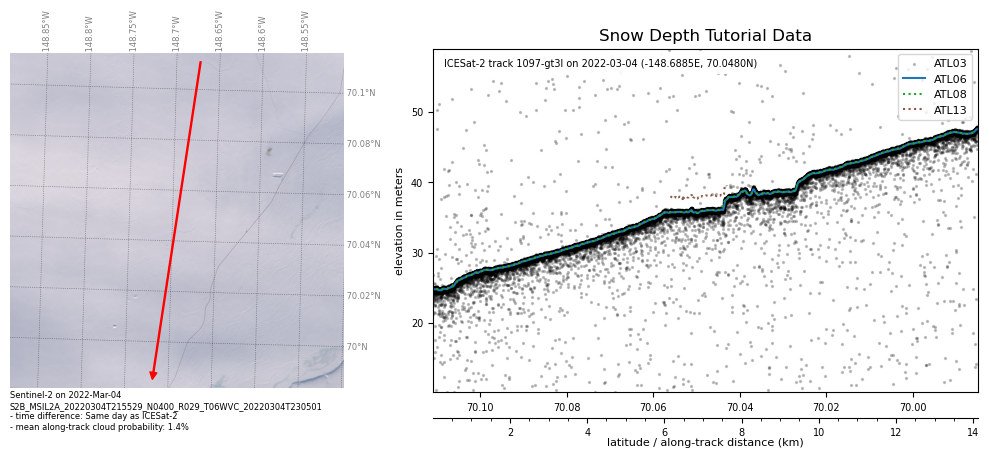
Snow Depth Tutorial Data#
track = 1097
gtx = 'gt3l'
latlims = [69.985, 70.111]
lonlims = [-148.85, -148.527]
date = '2022-03-04'
is2data = dataCollector(date=date, track=track, beam=gtx, latlims=latlims, lonlims=lonlims)
fig = is2data.visualize_sentinel2(max_cloud_prob=5, title='Snow Depth Tutorial Data', plot_filename='snowdepth-tutorial-viz.jpg')
--> Getting data from OpenAltimetry.
---> requesting ATL03 data... 55806 data points.
---> requesting ATL06 data... 708 data points.
---> requesting ATL07 data... No data.
---> requesting ATL08 data... 141 data points.
---> requesting ATL10 data... No data.
---> requesting ATL12 data... No data.
---> requesting ATL13 data... 159 data points.
The ground track is 14.1 km long.
Looking for Sentinel-2 images from 2022-02-22T12:00:00 to 2022-03-14T12:00:00 --> there are 6 cloud-free images.
Looking for Sentinel-2 images from 2022-02-12T12:00:00 to 2022-03-24T12:00:00 --> there are 10 cloud-free images.
--> Closest cloud-free Sentinel-2 image to ICESat:
    - product_id: S2B_MSIL2A_20220304T215529_N0400_R029_T06WVC_20220304T230501
    - time difference: Same day as ICESat-2
    - mean along-track cloud probability: 1.4
--> Downloaded the 8-bit RGB image as my-satellite-image.tif.
could not display ATL08 canopy data
--> Saved plot as snowdepth-tutorial-viz.jpg.
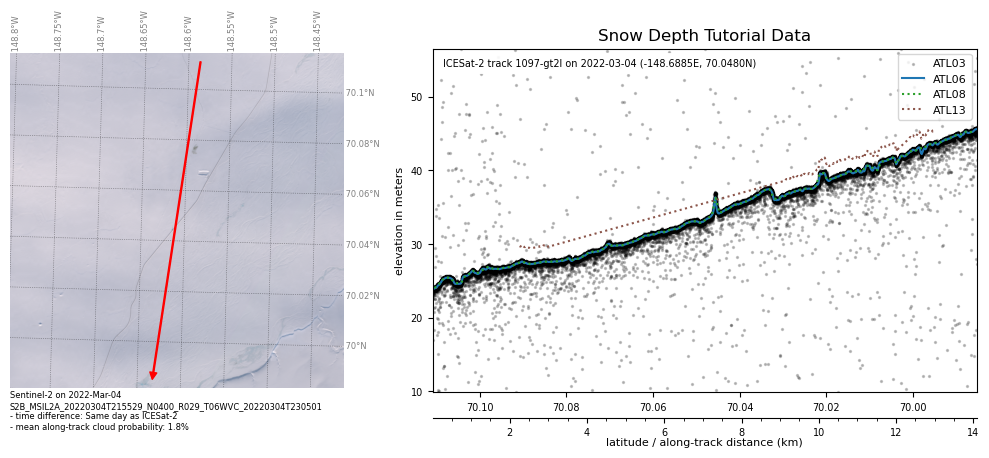
track = 1097
gtx = 'gt2l'
latlims = [69.985, 70.111]
lonlims = [-148.85, -148.527]
date = '2022-03-04'
is2data = dataCollector(date=date, track=track, beam=gtx, latlims=latlims, lonlims=lonlims)
fig = is2data.visualize_sentinel2(max_cloud_prob=5, title='Snow Depth Tutorial Data', plot_filename='snowdepth-tutorial-viz.jpg')
--> Getting data from OpenAltimetry.
---> requesting ATL03 data... 45519 data points.
---> requesting ATL06 data... 708 data points.
---> requesting ATL07 data... No data.
---> requesting ATL08 data... 141 data points.
---> requesting ATL10 data... No data.
---> requesting ATL12 data... No data.
---> requesting ATL13 data... 483 data points.
The ground track is 14.1 km long.
Looking for Sentinel-2 images from 2022-02-22T12:00:00 to 2022-03-14T12:00:00 --> there are 6 cloud-free images.
Looking for Sentinel-2 images from 2022-02-12T12:00:00 to 2022-03-24T12:00:00 --> there are 8 cloud-free images.
Looking for Sentinel-2 images from 2022-02-02T12:00:00 to 2022-04-03T12:00:00 --> there are 14 cloud-free images.
--> Closest cloud-free Sentinel-2 image to ICESat:
    - product_id: S2B_MSIL2A_20220304T215529_N0400_R029_T06WVC_20220304T230501
    - time difference: Same day as ICESat-2
    - mean along-track cloud probability: 1.8
--> Downloaded the 8-bit RGB image as my-satellite-image.tif.
could not display ATL08 canopy data
--> Saved plot as snowdepth-tutorial-viz.jpg.
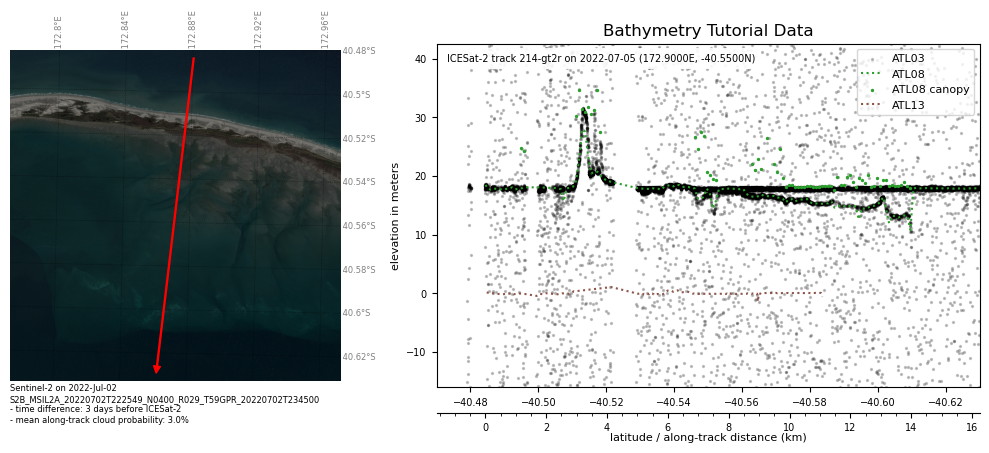
Bathymetry Tutorial Data#
from utils.oa import dataCollector
kwargs = {'track': 214,
          'date': '2022-07-05',
          'beam': 'gt2r',
          'lonlims': [172.66, 173.14],
          'latlims': [-40.63, -40.47]
         }
is2data = dataCollector(**kwargs)
fig = is2data.visualize_sentinel2(title='Bathymetry Tutorial Data', plot_filename='bathymetry-tutorial-viz.jpg')
--> Getting data from OpenAltimetry.
---> requesting ATL03 data... 50644 data points.
---> requesting ATL06 data... No data.
---> requesting ATL07 data... No data.
---> requesting ATL08 data... 145 data points.
---> requesting ATL10 data... No data.
---> requesting ATL12 data... No data.
---> requesting ATL13 data... 228 data points.
The ground track is 16.2 km long.
Looking for Sentinel-2 images from 2022-06-25T12:00:00 to 2022-07-15T12:00:00 --> there is 1 cloud-free image.
Looking for Sentinel-2 images from 2022-06-15T12:00:00 to 2022-07-25T12:00:00 --> there is 1 cloud-free image.
Looking for Sentinel-2 images from 2022-06-05T12:00:00 to 2022-08-04T12:00:00 --> there is 1 cloud-free image.
Looking for Sentinel-2 images from 2022-05-26T12:00:00 to 2022-08-14T12:00:00 --> there are 3 cloud-free images.
Looking for Sentinel-2 images from 2022-05-16T12:00:00 to 2022-08-24T12:00:00 --> there are 4 cloud-free images.
Looking for Sentinel-2 images from 2022-05-06T12:00:00 to 2022-09-03T12:00:00 --> there are 6 cloud-free images.
Looking for Sentinel-2 images from 2022-04-26T12:00:00 to 2022-09-13T12:00:00 --> there are 7 cloud-free images.
Looking for Sentinel-2 images from 2022-04-16T12:00:00 to 2022-09-23T12:00:00 --> there are 8 cloud-free images.
Looking for Sentinel-2 images from 2022-04-06T12:00:00 to 2022-10-03T12:00:00 --> there are 8 cloud-free images.
Looking for Sentinel-2 images from 2022-03-27T12:00:00 to 2022-10-13T12:00:00 --> there are 9 cloud-free images.
Looking for Sentinel-2 images from 2022-03-17T12:00:00 to 2022-10-23T12:00:00 --> there are 10 cloud-free images.
--> Closest cloud-free Sentinel-2 image to ICESat:
    - product_id: S2B_MSIL2A_20220702T222549_N0400_R029_T59GPR_20220702T234500
    - time difference: 3 days before ICESat-2
    - mean along-track cloud probability: 3.0
--> Downloaded the 8-bit RGB image as my-satellite-image.tif.
--> Saved plot as bathymetry-tutorial-viz.jpg.
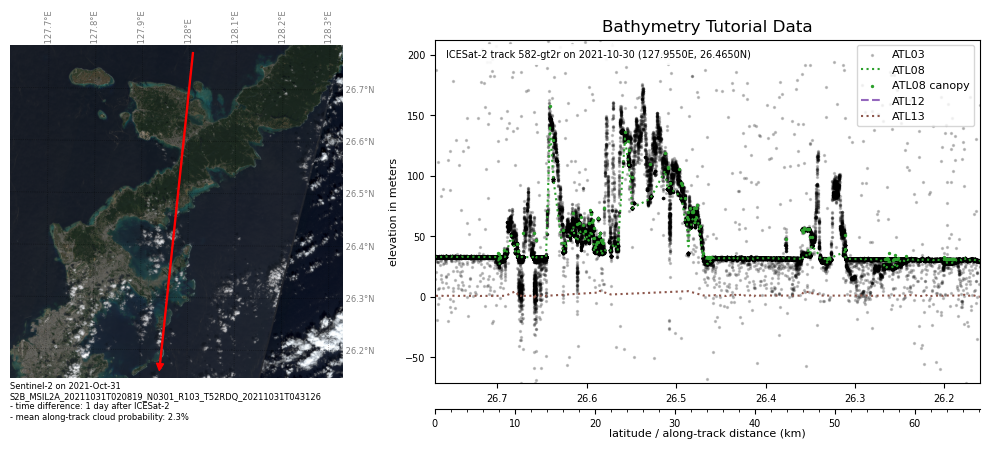
from utils.oa import dataCollector
kwargs = {'track': 582,
          'date': '2021-10-30',
          'beam': 'gt2r',
          'lonlims': [127.67, 128.24],
          'latlims': [26.16, 26.77]
         }
is2data = dataCollector(**kwargs)
fig = is2data.visualize_sentinel2(max_cloud_prob=20, title='Bathymetry Tutorial Data', plot_filename='bathymetry-tutorial-viz-1.jpg')
--> Getting data from OpenAltimetry.
---> requesting ATL03 data... 56813 data points.
---> requesting ATL06 data... No data.
---> requesting ATL07 data... No data.
---> requesting ATL08 data... 364 data points.
---> requesting ATL10 data... No data.
---> requesting ATL12 data... 1 data points.
---> requesting ATL13 data... 367 data points.
The ground track is 68.1 km long.
Looking for Sentinel-2 images from 2021-10-20T12:00:00 to 2021-11-09T12:00:00 --> there are 10 cloud-free images.
--> Closest cloud-free Sentinel-2 image to ICESat:
    - product_id: S2B_MSIL2A_20211031T020819_N0301_R103_T52RDQ_20211031T043126
    - time difference: 1 day after ICESat-2
    - mean along-track cloud probability: 2.3
-> download unsuccessful, increasing scale to 20.0...
-> download unsuccessful, increasing scale to 40.0...
--> Downloaded the 8-bit RGB image as my-satellite-image.tif.
--> Saved plot as bathymetry-tutorial-viz-1.jpg.
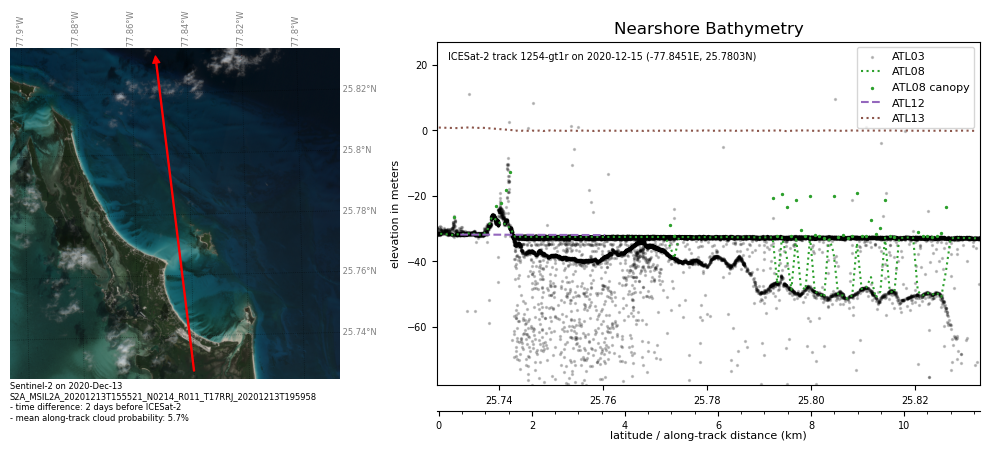
Nearshore bathymetry data from this tutorial#
Input data#
url = 'http://openaltimetry.org/data/api/icesat2/atl12?date=2020-12-15&minx=-77.858681&miny=25.728091&maxx=-77.831461&maxy=25.832559&trackId=1254&beamName=gt1r&beamName=gt1l&outputFormat=json'
is2data = dataCollector(oaurl=url, beam='gt1r')
fig = is2data.visualize_sentinel2(title='Nearshore Bathymetry')
--> Getting data from OpenAltimetry.
---> requesting ATL03 data... 34237 data points.
---> requesting ATL06 data... No data.
---> requesting ATL07 data... No data.
---> requesting ATL08 data... 114 data points.
---> requesting ATL10 data... No data.
---> requesting ATL12 data... 2 data points.
---> requesting ATL13 data... 317 data points.
The ground track is 11.6 km long.
Looking for Sentinel-2 images from 2020-12-05T12:00:00 to 2020-12-25T12:00:00 --> there are 4 cloud-free images.
Looking for Sentinel-2 images from 2020-11-25T12:00:00 to 2021-01-04T12:00:00 --> there are 10 cloud-free images.
--> Closest cloud-free Sentinel-2 image to ICESat:
    - product_id: S2A_MSIL2A_20201213T155521_N0214_R011_T17RRJ_20201213T195958
    - time difference: 2 days before ICESat-2
    - mean along-track cloud probability: 5.7
--> Downloaded the 8-bit RGB image as my-satellite-image.tif.
--> Saved plot as my-plot.jpg.
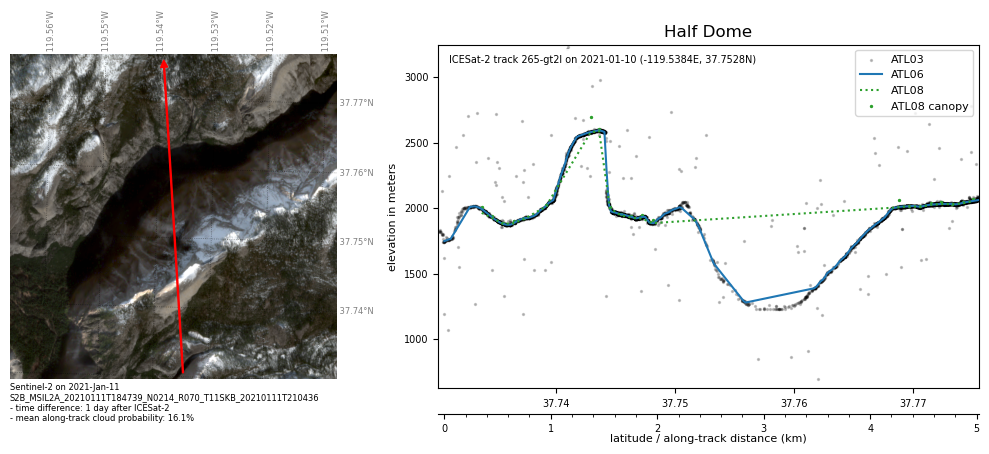
Half Dome#
url = 'http://openaltimetry.org/data/api/icesat2/atl06?date=2021-01-10&minx=-119.587886&miny=37.730067&maxx=-119.488871&maxy=37.775582&trackId=265&beamName=gt3r&beamName=gt3l&beamName=gt2r&beamName=gt2l&beamName=gt1r&beamName=gt1l&outputFormat=json'
is2data = dataCollector(oaurl=url, beam='gt2l')
fig = is2data.visualize_sentinel2(title='Half Dome')
--> Getting data from OpenAltimetry.
---> requesting ATL03 data... 5801 data points.
---> requesting ATL06 data... 187 data points.
---> requesting ATL07 data... No data.
---> requesting ATL08 data... 21 data points.
---> requesting ATL10 data... No data.
---> requesting ATL12 data... No data.
---> requesting ATL13 data... No data.
The ground track is 5.0 km long.
Looking for Sentinel-2 images from 2020-12-31T12:00:00 to 2021-01-20T12:00:00 --> there are 8 cloud-free images.
Looking for Sentinel-2 images from 2020-12-21T12:00:00 to 2021-01-30T12:00:00 --> there are 14 cloud-free images.
--> Closest cloud-free Sentinel-2 image to ICESat:
    - product_id: S2B_MSIL2A_20210111T184739_N0214_R070_T11SKB_20210111T210436
    - time difference: 1 day after ICESat-2
    - mean along-track cloud probability: 16.1
--> Downloaded the 8-bit RGB image as my-satellite-image.tif.
--> Saved plot as my-plot.jpg.
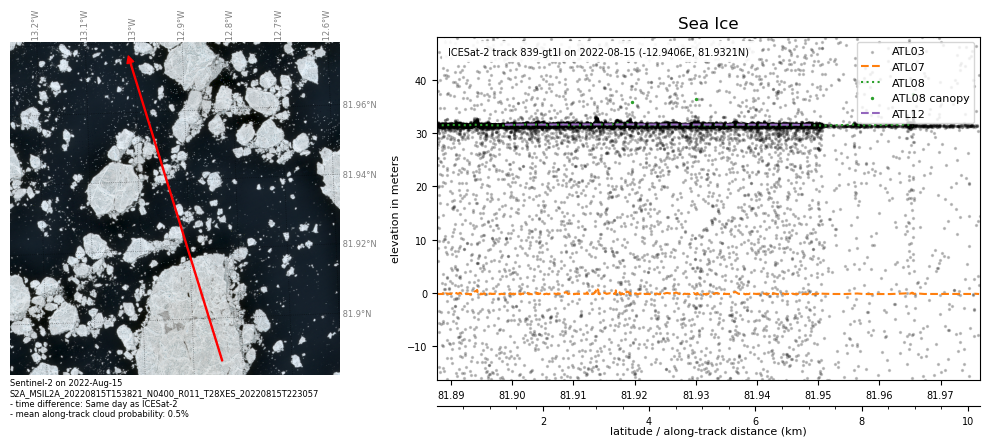
Sea Ice#
url = 'http://openaltimetry.org/data/api/icesat2/atl08?date=2022-08-15&minx=-13.254052238113646&miny=81.88762219346533&maxx=-12.627060835100693&maxy=81.9764994455186&trackId=839&beamName=gt2r&beamName=gt2l&beamName=gt1r&beamName=gt1l&outputFormat=json'
is2data = dataCollector(oaurl=url, beam='gt1l')
fig = is2data.visualize_sentinel2(title='Sea Ice')
--> Getting data from OpenAltimetry.
---> requesting ATL03 data... 47138 data points.
---> requesting ATL06 data... No data.
---> requesting ATL07 data... 1881 data points.
---> requesting ATL08 data... 77 data points.
---> requesting ATL10 data... No data.
---> requesting ATL12 data... 4 data points.
---> requesting ATL13 data... No data.
The ground track is 10.2 km long.
Looking for Sentinel-2 images from 2022-08-05T12:00:00 to 2022-08-25T12:00:00 --> there are 40 cloud-free images.
--> Closest cloud-free Sentinel-2 image to ICESat:
    - product_id: S2A_MSIL2A_20220815T153821_N0400_R011_T28XES_20220815T223057
    - time difference: Same day as ICESat-2
    - mean along-track cloud probability: 0.5
--> Downloaded the 8-bit RGB image as my-satellite-image.tif.
--> Saved plot as my-plot.jpg.
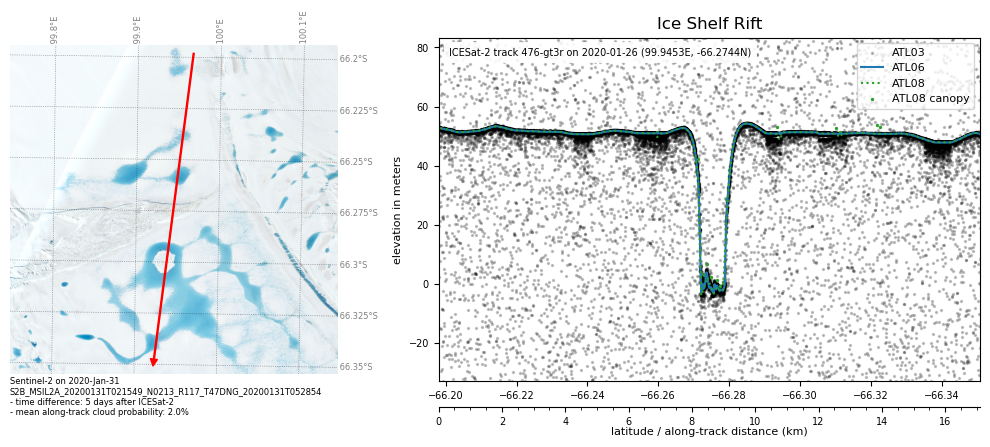
Ice Shelf Rift#
Input data#
url = 'http://openaltimetry.org/data/api/icesat2/atl06?date=2020-01-26&minx=99.85237589431291&miny=-66.35086607273658&maxx=100.0381369994367&maxy=-66.19796463586664&trackId=476&beamName=gt3r&beamName=gt3l&beamName=gt2r&beamName=gt2l&outputFormat=json'
is2data = dataCollector(oaurl=url, beam='gt3r')
fig = is2data.visualize_sentinel2(title='Ice Shelf Rift')
--> Getting data from OpenAltimetry.
---> requesting ATL03 data... 48749 data points.
---> requesting ATL06 data... 847 data points.
---> requesting ATL07 data... No data.
---> requesting ATL08 data... 172 data points.
---> requesting ATL10 data... No data.
---> requesting ATL12 data... No data.
---> requesting ATL13 data... No data.
The ground track is 17.1 km long.
Looking for Sentinel-2 images from 2020-01-16T12:00:00 to 2020-02-05T12:00:00 --> there is 1 cloud-free image.
Looking for Sentinel-2 images from 2020-01-06T12:00:00 to 2020-02-15T12:00:00 --> there are 2 cloud-free images.
Looking for Sentinel-2 images from 2019-12-27T12:00:00 to 2020-02-25T12:00:00 --> there are 3 cloud-free images.
Looking for Sentinel-2 images from 2019-12-17T12:00:00 to 2020-03-06T12:00:00 --> there are 4 cloud-free images.
Looking for Sentinel-2 images from 2019-12-07T12:00:00 to 2020-03-16T12:00:00 --> there are 7 cloud-free images.
Looking for Sentinel-2 images from 2019-11-27T12:00:00 to 2020-03-26T12:00:00 --> there are 8 cloud-free images.
Looking for Sentinel-2 images from 2019-11-17T12:00:00 to 2020-04-05T12:00:00 --> there are 10 cloud-free images.
--> Closest cloud-free Sentinel-2 image to ICESat:
    - product_id: S2B_MSIL2A_20200131T021549_N0213_R117_T47DNG_20200131T052854
    - time difference: 5 days after ICESat-2
    - mean along-track cloud probability: 2.0
--> Downloaded the 8-bit RGB image as my-satellite-image.tif.
--> Saved plot as my-plot.jpg.
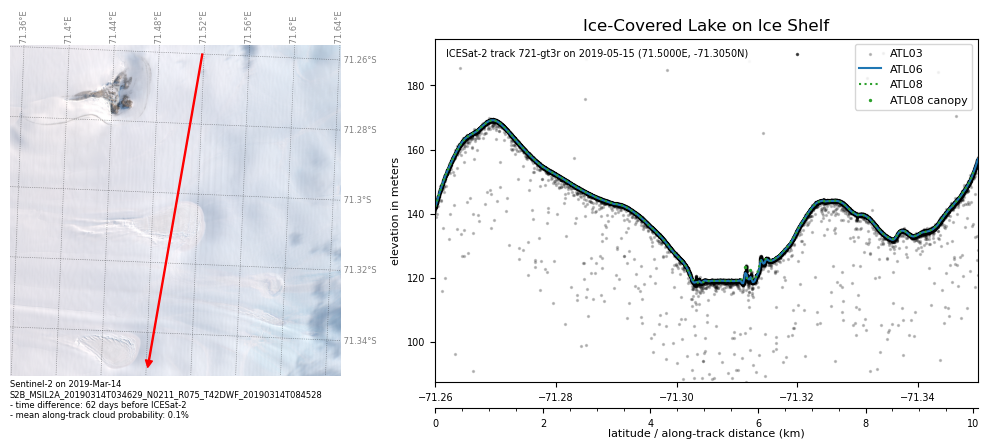
Ice-Covered Lake on Ice Shelf#
kwargs = {'track': 721,
          'date': '2019-05-15',
          'beam': 'gt3r',
          'latlims': [-71.35, -71.26],
          'lonlims': [71.41, 71.59]
         }
is2data = dataCollector(**kwargs)
fig = is2data.visualize_sentinel2(max_cloud_prob=5, title='Ice-Covered Lake on Ice Shelf')
--> Getting data from OpenAltimetry.
---> requesting ATL03 data... 29323 data points.
---> requesting ATL06 data... 509 data points.
---> requesting ATL07 data... No data.
---> requesting ATL08 data... 102 data points.
---> requesting ATL10 data... No data.
---> requesting ATL12 data... No data.
---> requesting ATL13 data... No data.
The ground track is 10.1 km long.
Looking for Sentinel-2 images from 2019-05-05T12:00:00 to 2019-05-25T12:00:00 --> there are not enough cloud-free images: widening date range...
Looking for Sentinel-2 images from 2019-04-25T12:00:00 to 2019-06-04T12:00:00 --> there are not enough cloud-free images: widening date range...
Looking for Sentinel-2 images from 2019-04-15T12:00:00 to 2019-06-14T12:00:00 --> there are not enough cloud-free images: widening date range...
Looking for Sentinel-2 images from 2019-04-05T12:00:00 to 2019-06-24T12:00:00 --> there are not enough cloud-free images: widening date range...
Looking for Sentinel-2 images from 2019-03-26T12:00:00 to 2019-07-04T12:00:00 --> there are not enough cloud-free images: widening date range...
Looking for Sentinel-2 images from 2019-03-16T12:00:00 to 2019-07-14T12:00:00 --> there are not enough cloud-free images: widening date range...
Looking for Sentinel-2 images from 2019-03-06T12:00:00 to 2019-07-24T12:00:00 --> there are 2 cloud-free images.
Looking for Sentinel-2 images from 2019-02-24T12:00:00 to 2019-08-03T12:00:00 --> there are 4 cloud-free images.
Looking for Sentinel-2 images from 2019-02-14T12:00:00 to 2019-08-13T12:00:00 --> there are 6 cloud-free images.
Looking for Sentinel-2 images from 2019-02-04T12:00:00 to 2019-08-23T12:00:00 --> there are 8 cloud-free images.
Looking for Sentinel-2 images from 2019-01-25T12:00:00 to 2019-09-02T12:00:00 --> there are 8 cloud-free images.
Looking for Sentinel-2 images from 2019-01-15T12:00:00 to 2019-09-12T12:00:00 --> there are 10 cloud-free images.
--> Closest cloud-free Sentinel-2 image to ICESat:
    - product_id: S2B_MSIL2A_20190314T034629_N0211_R075_T42DWF_20190314T084528
    - time difference: 62 days before ICESat-2
    - mean along-track cloud probability: 0.1
--> Downloaded the 8-bit RGB image as my-satellite-image.tif.
--> Saved plot as my-plot.jpg.
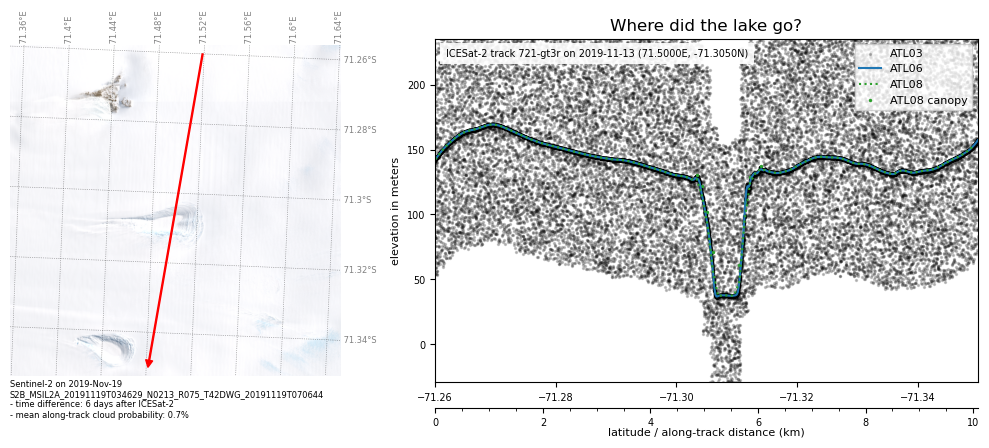
Change the date only now#
kwargs['date'] = '2019-11-13'
is2data = dataCollector(**kwargs)
fig = is2data.visualize_sentinel2(max_cloud_prob=20, title='Where did the lake go?')
--> Getting data from OpenAltimetry.
---> requesting ATL03 data... 50884 data points.
---> requesting ATL06 data... 509 data points.
---> requesting ATL07 data... No data.
---> requesting ATL08 data... 102 data points.
---> requesting ATL10 data... No data.
---> requesting ATL12 data... No data.
---> requesting ATL13 data... No data.
The ground track is 10.1 km long.
Looking for Sentinel-2 images from 2019-11-03T12:00:00 to 2019-11-23T12:00:00 --> there are 2 cloud-free images.
Looking for Sentinel-2 images from 2019-10-24T12:00:00 to 2019-12-03T12:00:00 --> there are 4 cloud-free images.
Looking for Sentinel-2 images from 2019-10-14T12:00:00 to 2019-12-13T12:00:00 --> there are 6 cloud-free images.
Looking for Sentinel-2 images from 2019-10-04T12:00:00 to 2019-12-23T12:00:00 --> there are 8 cloud-free images.
Looking for Sentinel-2 images from 2019-09-24T12:00:00 to 2020-01-02T12:00:00 --> there are 10 cloud-free images.
--> Closest cloud-free Sentinel-2 image to ICESat:
    - product_id: S2B_MSIL2A_20191119T034629_N0213_R075_T42DWG_20191119T070644
    - time difference: 6 days after ICESat-2
    - mean along-track cloud probability: 0.7
--> Downloaded the 8-bit RGB image as my-satellite-image.tif.
--> Saved plot as my-plot.jpg.