SlideRule Interactive Feature Find
Contents
SlideRule Interactive Feature Find#
SlideRule is an on-demand science data processing service that runs in on Amazon Web Services and responds to REST API calls to process and return science results. SlideRule was designed to enable researchers and other data systems to have low-latency access to custom-generated, high-level, analysis-ready data products using processing parameters supplied at the time of the request.
Documentation for using SlideRule is available from the project website
Learning goals#
Finding interesting features with ICESat-2!
from sliderule import icesat2, ipysliderule, sliderule, io
import ipywidgets as widgets
import warnings
# turn off warnings for demo
warnings.filterwarnings('ignore')
Paste Show Code contents from Web Demo#
icesat2.init("slideruleearth.io")
parms = {
    "srt": 0,
    "len": 40,
    "res": 20,
    "pass_invalid": True,
    "cnf": -2,
    "atl08_class": [
        "atl08_noise",
        "atl08_ground",
        "atl08_canopy",
        "atl08_top_of_canopy",
        "atl08_unclassified"
    ],
    "yapc": {
        "score": 0
    },
    "ats": 20.0,
    "cnt": 10,
    "poly": [
        {
            "lon": 13.648796,
            "lat": 52.007611
        },
        {
            "lon": 13.847923,
            "lat": 52.007611
        },
        {
            "lon": 13.847923,
            "lat": 52.075609
        },
        {
            "lon": 13.648796,
            "lat": 52.075609
        },
        {
            "lon": 13.648796,
            "lat": 52.007611
        }
    ],
    "rgt": 84,
    "cycle": 7,
    "track": 1,
    "asset": "icesat2"
}
gdf = icesat2.atl03sp(parms, asset="icesat2")
Review GeoDataFrame output#
Can inspect the columns, number of returns and returns at the top of the GeoDataFrame.
See the ICESat-2 documentation for descriptions of each column
print(f'Returned {gdf.shape[0]} records')
gdf.head()
Returned 39631 records
| cycle | sc_orient | background_rate | track | segment_id | rgt | segment_dist | solar_elevation | height | atl03_cnf | landcover | atl08_class | quality_ph | distance | yapc_score | snowcover | relief | pair | geometry | spot | |
|---|---|---|---|---|---|---|---|---|---|---|---|---|---|---|---|---|---|---|---|---|
| time | ||||||||||||||||||||
| 2020-04-01 01:18:14.833129216 | 7 | 1 | 0.0 | 1 | 712496 | 84 | 1.427102e+07 | -26.952822 | 96.497551 | 4 | 255 | 1 | 0 | -18.253809 | 98 | 255 | 0.0 | 0 | POINT (13.75534 52.07558) | 6 |
| 2020-04-01 01:18:14.833328896 | 7 | 1 | 0.0 | 1 | 712496 | 84 | 1.427102e+07 | -26.952822 | 96.632645 | 4 | 255 | 1 | 0 | -16.830337 | 146 | 255 | 0.0 | 0 | POINT (13.75534 52.07557) | 6 |
| 2020-04-01 01:18:14.833928960 | 7 | 1 | 0.0 | 1 | 712496 | 84 | 1.427102e+07 | -26.952822 | 108.836823 | 4 | 255 | 2 | 0 | -12.584853 | 67 | 255 | 0.0 | 0 | POINT (13.75533 52.07553) | 6 |
| 2020-04-01 01:18:14.833928960 | 7 | 1 | 0.0 | 1 | 712496 | 84 | 1.427102e+07 | -26.952822 | 96.426636 | 4 | 255 | 1 | 0 | -12.560813 | 244 | 255 | 0.0 | 0 | POINT (13.75533 52.07553) | 6 |
| 2020-04-01 01:18:14.834029056 | 7 | 1 | 0.0 | 1 | 712496 | 84 | 1.427102e+07 | -26.952822 | 108.848206 | 4 | 255 | 2 | 0 | -11.873586 | 67 | 255 | 0.0 | 0 | POINT (13.75533 52.07552) | 6 |
Interactive Mapping with Leaflet#
| Global (Web Mercator, EPSG:3857) | North (Alaska Polar Stereographic, EPSG:5936) | South (Antarctic Polar Stereographic, EPSG:3031) |
|---|---|---|
# display widgets for setting SlideRule parameters
SRwidgets = ipysliderule.widgets()
SRwidgets.set_atl03_defaults()
widgets.VBox([
    SRwidgets.projection,
    SRwidgets.layers,
    SRwidgets.raster_functions
])
# center map on polygon centroid
lon, lat = io.from_region(parms['poly'])
cx, cy = io.centroid(lon, lat)
# create ipyleaflet map in specified projection
m = ipysliderule.leaflet(SRwidgets.projection.value,
    center=(cy, cx), prefer_canvas=True)
# install click handler callback
m.add_selected_callback(SRwidgets.atl03_click_handler)
# add polygon from web demo code
m.add_region([parms['poly']])
# show map
m.map
# add any selected base layers
m.add_layer(
    layers=SRwidgets.layers.value,
    rendering_rule=SRwidgets.rendering_rule
)
Add GeoDataFrame to map#
For stability of the leaflet map, SlideRule will as a default limit the plot to have up to 10000 points from the GeoDataFrame
GeoDataFrames can be plotted in any available matplotlib colormap
widgets.VBox([
    SRwidgets.variable,
    SRwidgets.cmap,
    SRwidgets.reverse,
])
%matplotlib inline
# ATL03 fields for hover tooltip
fields = m.default_atl03_fields()
m.GeoData(gdf, column_name=SRwidgets.variable.value, cmap=SRwidgets.colormap,
    max_plot_points=10000, tooltip=True, colorbar=True, fields=fields)
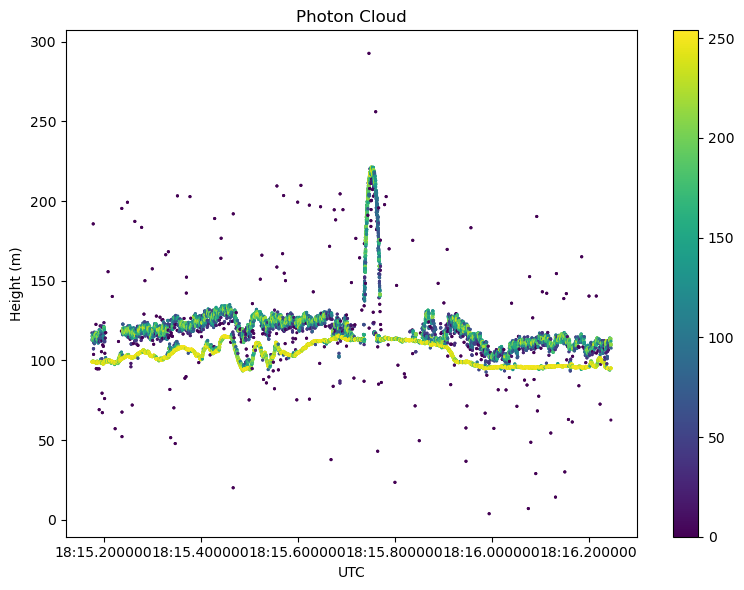
Visualize photons as an along-track plot#
widgets.VBox([
    SRwidgets.plot_classification,
    SRwidgets.rgt,
    SRwidgets.ground_track,
    SRwidgets.cycle,
])
%matplotlib inline
SRwidgets.plot(atl03=gdf, kind='scatter', title='Photon Cloud',
    cmap=SRwidgets.colormap, legend=True, legend_frameon=True,
    classification=SRwidgets.plot_classification.value,
    segments=False)